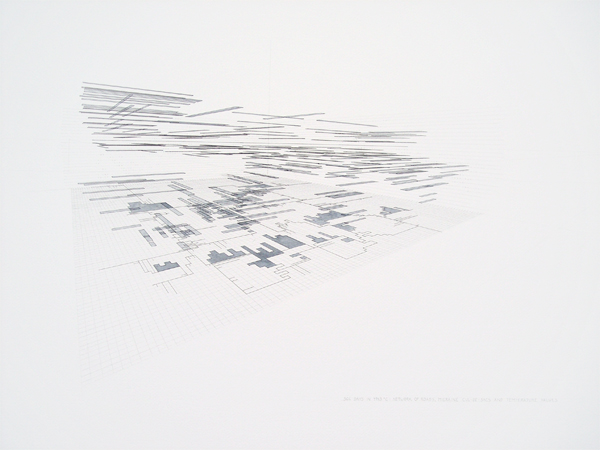
366 Days in 4743°C: Network of Roads, Migraine Cul-De-Sacs and Temperature Values, 2012, pencil, ink and watercolour on paper, 85cm x 60cm
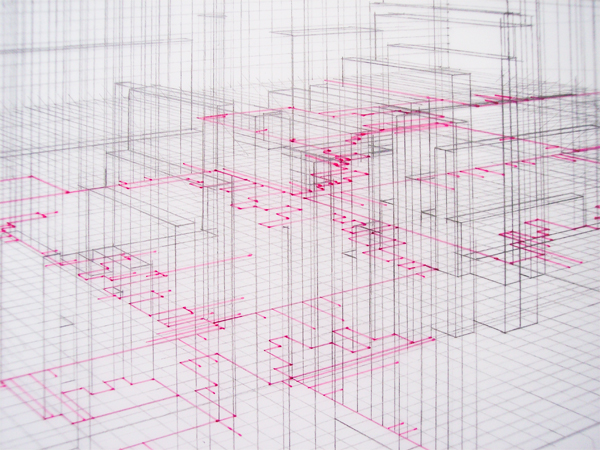
311 Days, 110 Migraines: A perspective (detail), 2012, pencil and ink on mylar, 84cm x 47cm
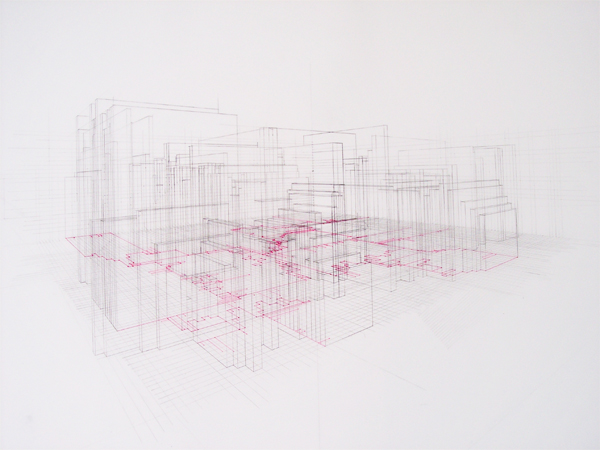
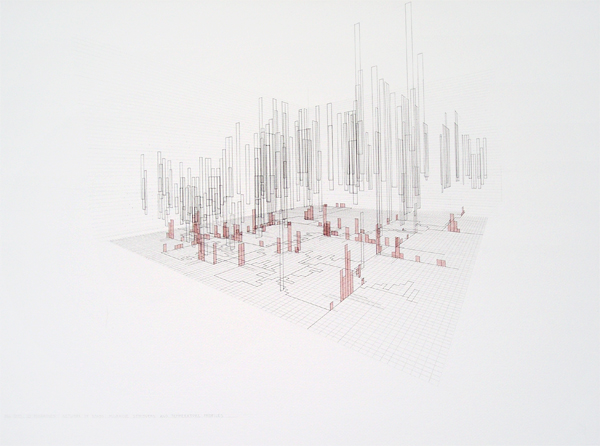
311 Days, 110 Migraines: A perspective, 2012, pencil and ink on mylar, 84cm x 47cm
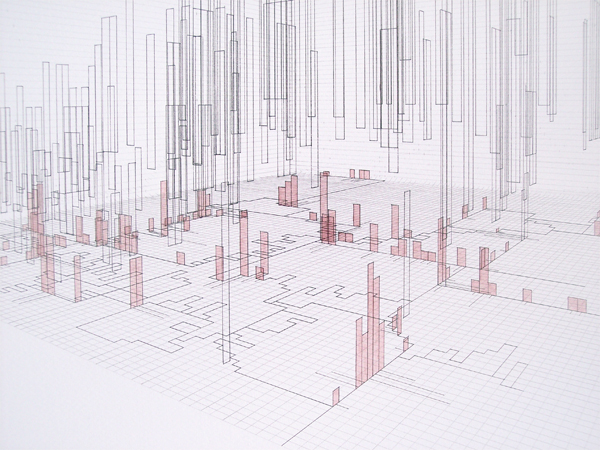
366 Days, 121 Migraines: Network of Roads, Migraine Stopovers and Temperature Profiles (detail), 2012, pencil, ink and watercolour on paper, 85cm x 60cm
366 Days, 121 Migraines: Network of Roads, Migraine Stopovers and Temperature Profiles, 2012, pencil, ink and watercolour on paper, 85cm x 60cm
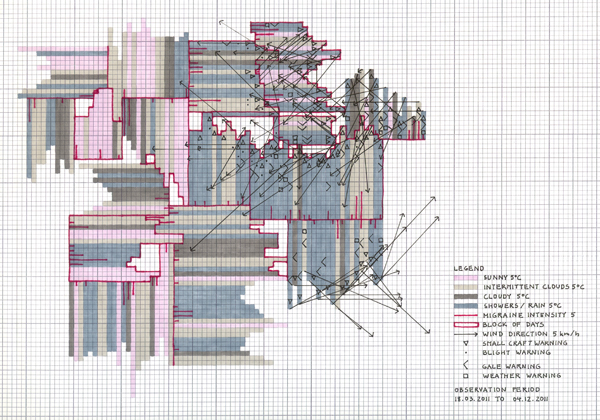
262 Correlations (2011), ink on graph paper, 26 x 18 cm
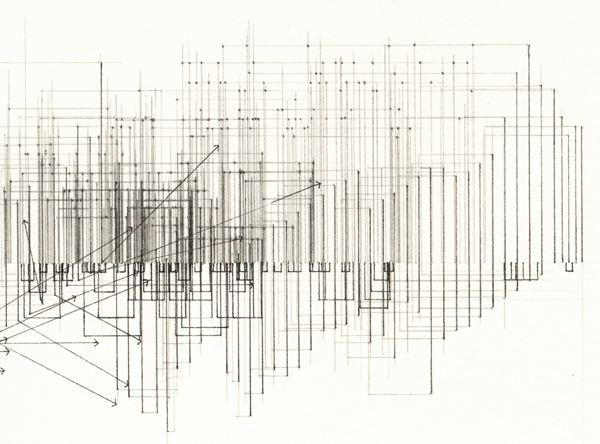
Wireframe Sectrion Through July 10th to September 29th 2011 (detail, 2012), pencil and ink on paper, 80 x 22 cm
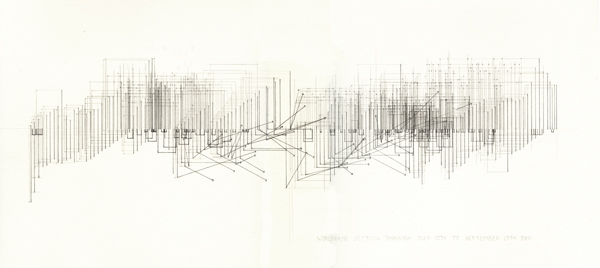
Wireframe Section Through July 10th to September 29th 2011 (2012), pencil and ink on paper, 80 x 22 cm
‘Correlations’ follows on from previous investigations into mapping the abstract.
The relationships of weather, air temperature and migraine form the basis of the research. The work hopes to acknowledge what ‘is’, without the need to revise, through spatially mapping data collected over the past 366 days. It explores relationships of the accumulated as reality and the mapped as imaginary.